Integrating VirusTotal IoCs into the Home Network Guardian
As part of the Home Network Guardian project, a key element for elevating security is the integration of Indicators of Compromise (IoC) data from external sources like VirusTotal. This allows for proactive monitoring and rapid response to potential threats before they reach critical assets on the home network.
Data from the VirusTotal API is automatically collected and stored in a central MySQL database. This storage enables historical analysis and advanced visualization within Grafana.
What is Analyzed? CTI Data Architecture
The Grafana dashboard (defined in virus_total.json) transforms raw VirusTotal scan results into clear CTI indicators, analyzing data points such as:
- Domain and IP Reputation: Monitoring the Detection Ratio (malicious detections / total scanners) for domains and IP addresses observed in network traffic. Ratios above a defined threshold are immediately flagged as potential threats.
- Scan Statistics: Tracking the number of scans performed in VirusTotal over a given period, which helps assess monitoring activity and data freshness.
- Last Analysis Status: The time elapsed since the last analysis of a specific IoC, ensuring the system operates on the most current reputation data.
- Attack Vector Visualization: Utilizing data segmentation in MySQL to visualize which types of IoCs (e.g., malicious domains, C2 infrastructure) are most prevalent during a specific timeframe.
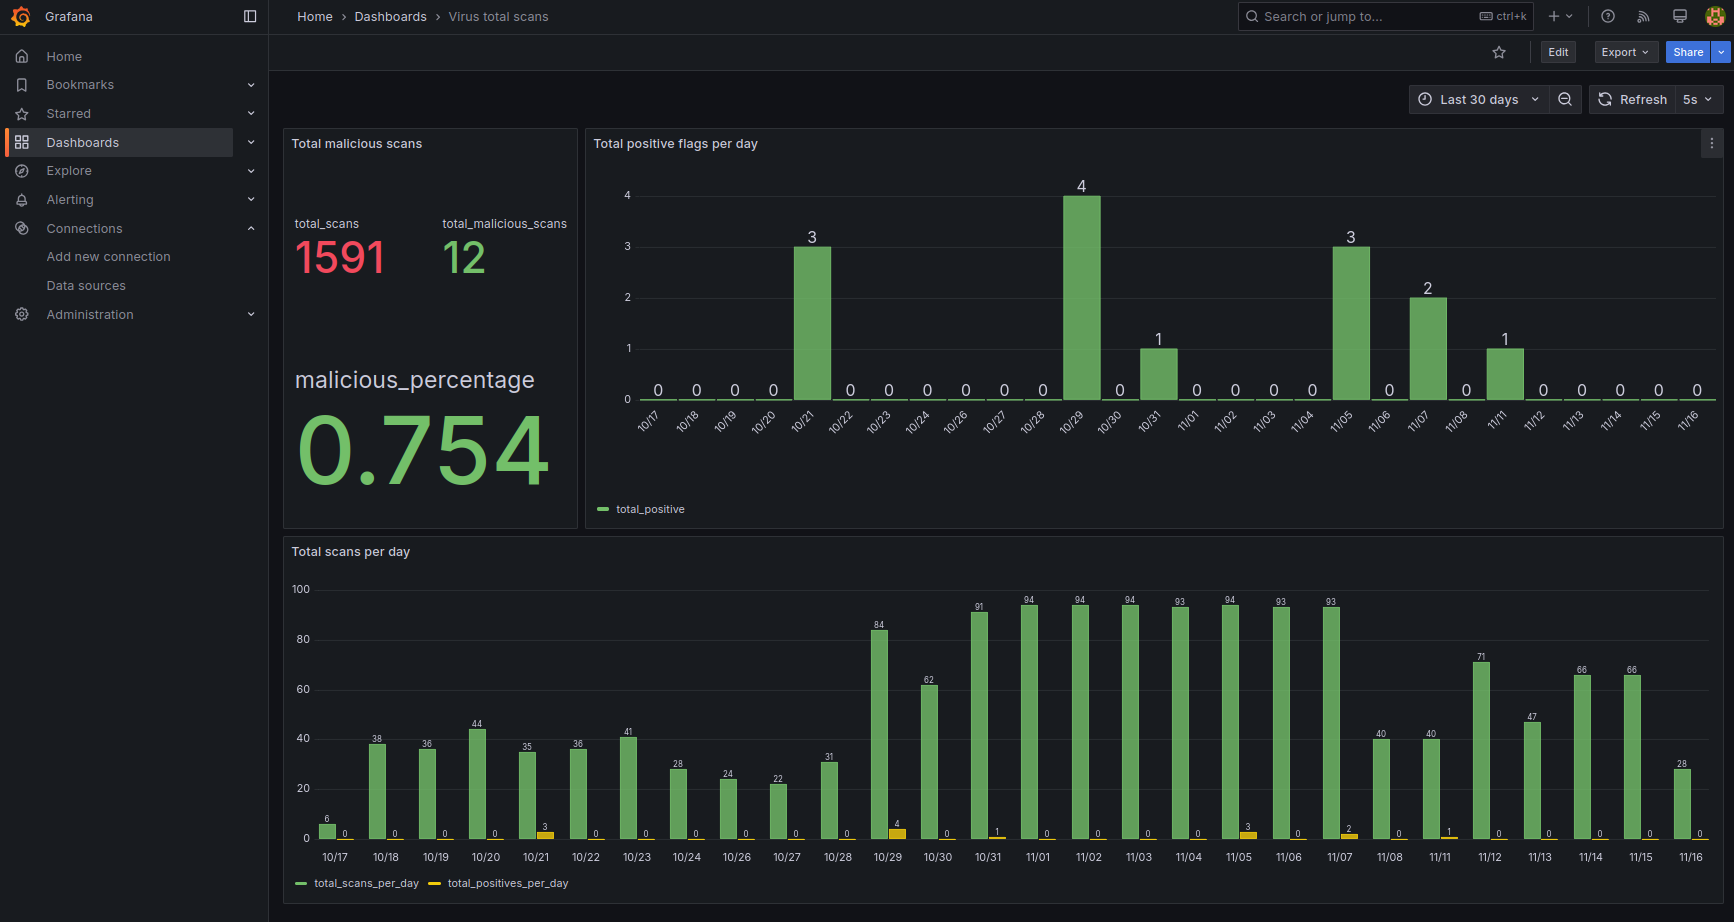
Visualizing VirusTotal IoC data in Grafana for proactive threat hunting.
Benefits and Added Value for Security
Visualizing VirusTotal data in Grafana goes beyond simple reporting—it actively supports Threat Hunting efforts:
- Rapid Threat Identification: Grafana immediately signals anomalies (e.g., a domain with a high Detection Ratio), enabling prompt action to block it at the Pi-hole or firewall level.
- Data-Driven Security: Security decisions are based on hard reputation data from one of the world's largest CTI sources.
- Visual Cohesion: Integrating reputation indicators with general network metrics (e.g., Pi-hole load, Suricata alerts) provides a comprehensive, unified view of the security posture.
- Proactive Defense: This setup shifts the defense strategy from reactive blocking of known threats to proactive monitoring of indicators that may suggest new or emerging attack campaigns.