Source Code - Home Network Guardian
The source code for the Home Network Guardian project is available on GitHub. It contains all the configurations and scripts used to set up various network security and monitoring services, including Pi-hole, Squid Proxy, and others.
Access the Code
To explore the full project and contribute, you can find the source code at the following link:
View on GitHubHardware
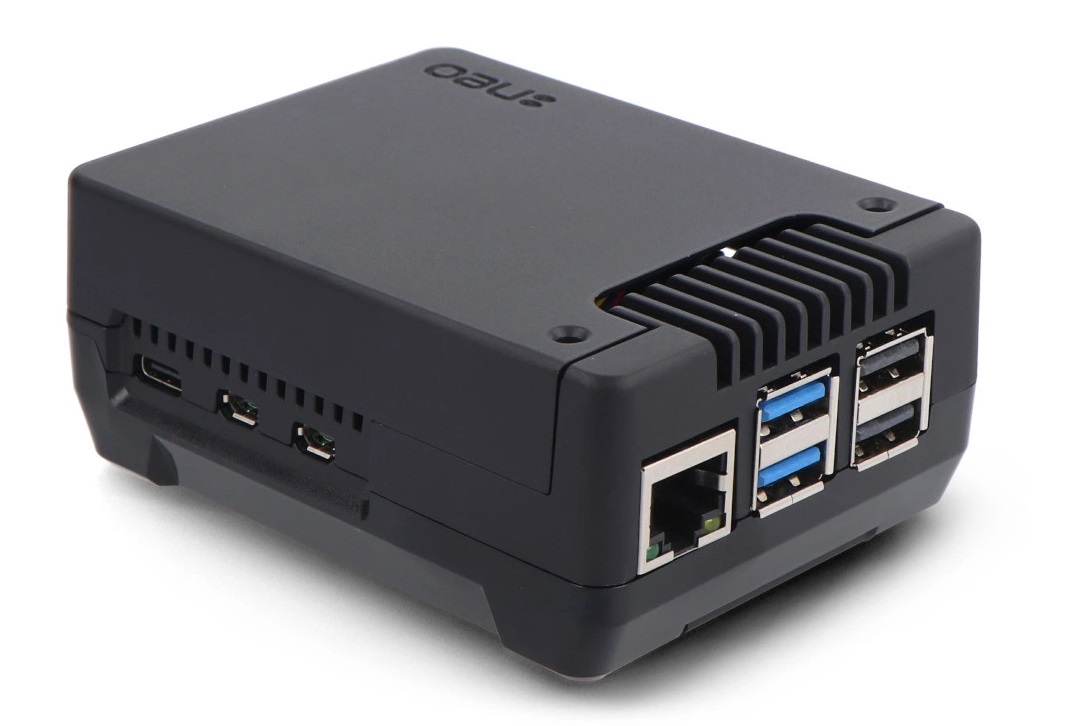
For this project, I chose the Raspberry Pi 5 with 8GB RAM, paired with the Argon NEO 5 M.2 NVMe PCIe case. This combination provides a significant boost in performance and storage capabilities compared to previous models. The Raspberry Pi 5 offers a faster CPU and GPU, making it more efficient for handling multiple services simultaneously. With 8GB of RAM, it ensures smooth operation for applications like Pi-hole, Unbound, and Suricata, even under high network traffic. The built-in PCIe support allows me to utilize an NVMe SSD, which greatly improves storage performance compared to traditional microSD cards. The Argon NEO 5 case was chosen for its excellent passive cooling and support for NVMe storage. It keeps the Raspberry Pi 5 at optimal temperatures, reducing the risk of overheating during continuous operation. Additionally, the sturdy aluminum design enhances durability while maintaining a compact form factor. This setup not only provides high-speed network performance but also ensures stability and reliability for long-term use, making it ideal for a home lab environment with minimal maintenance requirements.
Docker and Containerization
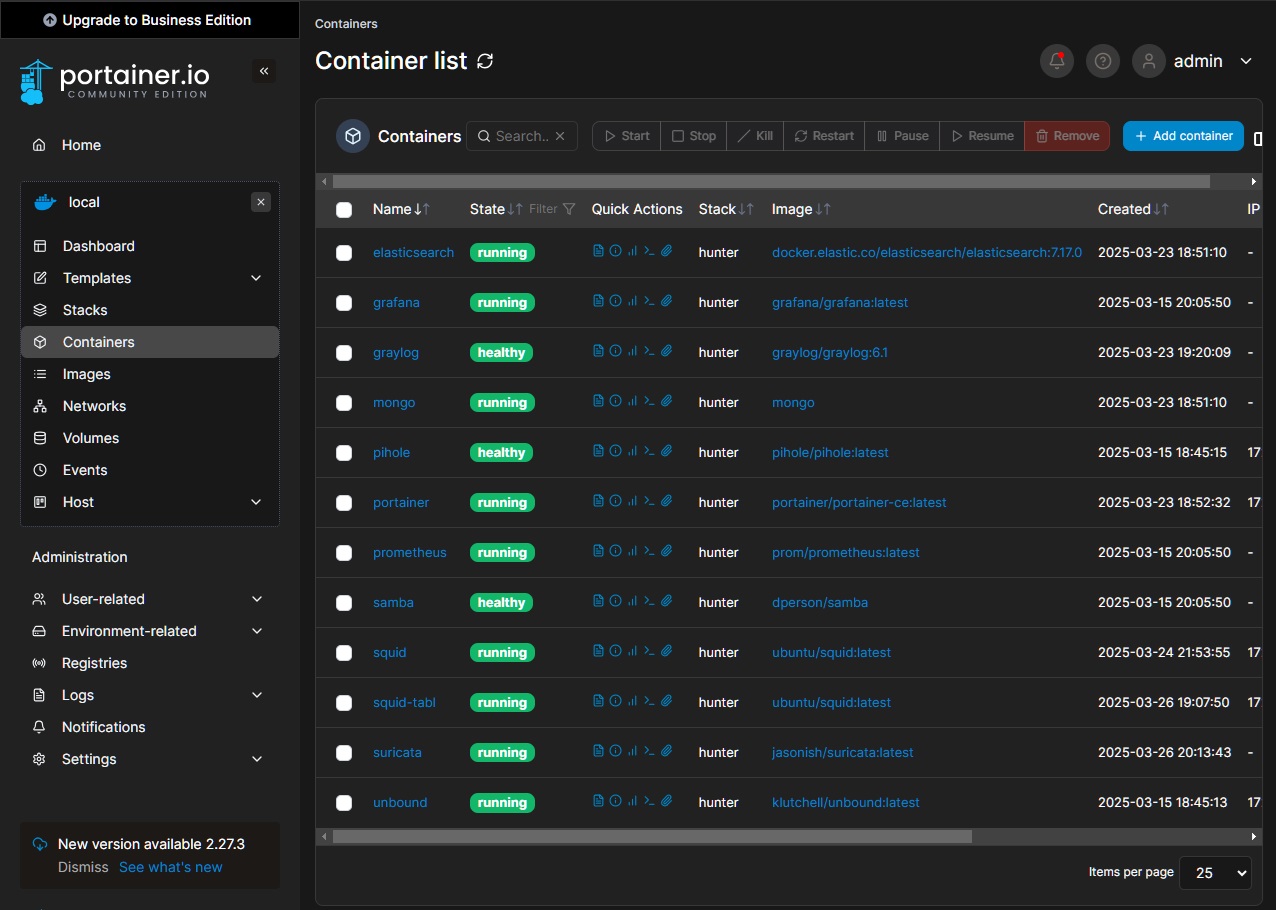
To efficiently manage and deploy multiple services, I chose Docker as the core containerization platform. Docker provides lightweight, isolated environments for applications, ensuring better security, ease of deployment, and resource efficiency compared to traditional virtual machines. In combination with Docker, I utilize Portainer for a user-friendly graphical interface to manage containers, making it easier to monitor and control services without relying solely on command-line operations. This improves overall maintainability and speeds up troubleshooting.
Additionally, Prometheus and Grafana are integrated to collect and visualize system metrics, providing real-time insights into performance, resource utilization, and potential issues. This stack allows me to track trends over time, optimize configurations, and quickly respond to anomalies. By leveraging Docker, Portainer, Prometheus, and Grafana, this setup achieves high modularity, scalability, and efficient monitoring, making it a perfect solution for managing a home lab or small-scale production environment.
Graylog for Centralized Logging
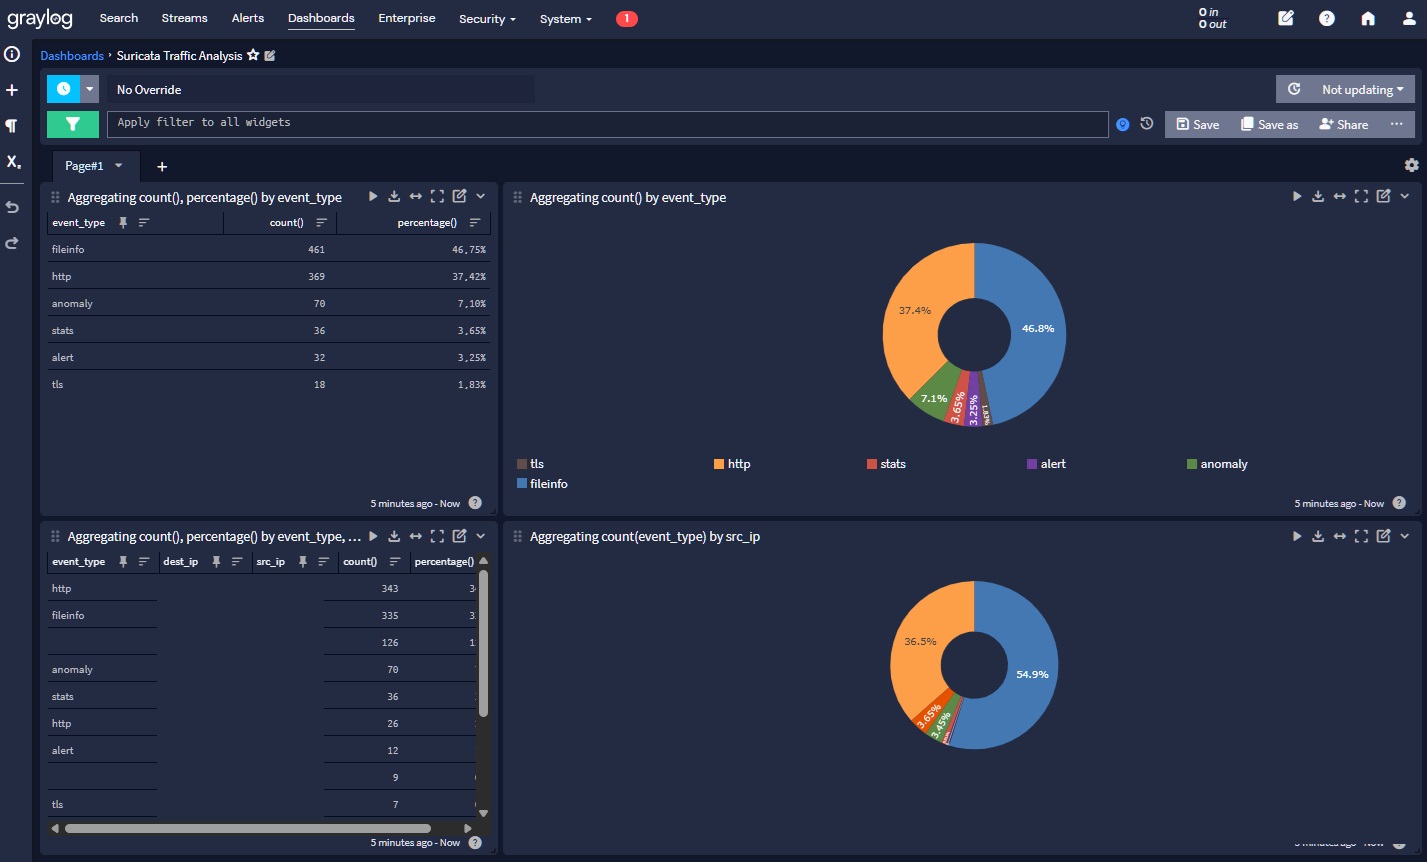
Graylog plays a crucial role in my infrastructure by centralizing logs from various sources, including Suricata and Squid Proxy. Suricata, a powerful IDS/IPS system, provides detailed security event logs that help identify network threats and malicious activities. These logs allow for rapid detection and response to potential breaches, helping to maintain the security integrity of the environment.
Similarly, Squid Proxy logs provide valuable insights into web traffic patterns, user activity, and potential access control violations. By aggregating Squid Proxy logs in Graylog, I can quickly spot unusual browsing behavior, blocked sites, or attempted policy violations, ensuring that all network traffic is closely monitored and managed.
Graylog's ability to parse, search, and visualize these logs in a user-friendly interface simplifies threat analysis, incident response, and troubleshooting. By correlating the data from Suricata and Squid Proxy, I can get a holistic view of the network activity, enabling faster detection of anomalies and enhancing overall network security.
Pi-hole - Network-Wide Ad Blocking
Pi-hole provides comprehensive network-level ad and tracker blocking, improving browsing speed, privacy, and security.
Key Features
- Block ads across entire network
- Customizable blocklists
- Detailed query logging
- Web interface for management
Docker Configuration
pihole:
    image: pihole/pihole:latest
    container_name: pihole
    hostname: pihole
    networks:
      internal_network:
        ipv4_address: 172.20.0.3
    environment:
      TZ: "${TZ}"
      PIHOLE_DNS_: "172.20.0.2#53"
    volumes:
      - './etc-pihole:/etc/pihole'
      - './etc-dnsmasq.d:/etc/dnsmasq.d'
    ports:
      - "53:53/tcp"
      - "53:53/udp"
      - "80:80/tcp"
      - "443:443/tcp"
    restart: unless-stopped
    depends_on:
      - unbound
Unbound - Local DNS Resolver
Unbound is a validating, recursive, and caching DNS resolver that significantly enhances network privacy and security by resolving DNS queries locally.
Key Features
- Recursive DNS resolution
- DNSSEC validation
- Caching to improve performance
- Enhanced privacy by avoiding third-party DNS providers
Docker Configuration
unbound:
    image: klutchell/unbound:latest
    container_name: unbound
    hostname: unbound
    networks:
      internal_network:
        ipv4_address: 172.20.0.2
    volumes:
      - './etc-unbound/unbound.conf:/etc/unbound/unbound.conf'
    restart: unless-stopped
Squid Proxy - Traffic Filtering and Monitoring
Squid Proxy is used for monitoring and filtering network traffic, specifically designed to control access to web content and ensure a safe browsing environment for children.
Key Features
- Web traffic monitoring and filtering
- Customizable blocklists for unwanted domains
- Detailed logging of requests and user activity
- Access control for safe browsing
Docker Configuration
squid:
	image: ubuntu/squid:latest
	container_name: squid
	user: "root"
	hostname: squid
	networks:
	  internal_network:
		ipv4_address: 172.20.0.4
	volumes:
	  - './etc-squid/squid.conf:/etc/squid/squid.conf'
	  - './var-log-squid:/var/log/squid'
	  - './etc-squid/blocklists:/etc/squid/blocklists'
	ports:
	  - "3128:3128/tcp"
	restart: unless-stopped
Configuration
This Squid Proxy is specifically configured to monitor and filter internet traffic for children’s devices, ensuring they access only appropriate content. The configuration includes:
http_port 3128

acl blocklist_stevenblack dstdomain "/etc/squid/blocklists/stevenblack-domains.txt"

http_access allow all

dns_nameservers 172.20.0.3

logformat jsonlog {"timestamp":"%tl","client":"%>a","method":"%rm","url":"%ru","status":%Hs,"bytes":%h","user_agent":"%{User-Agent}>h","blocked":%ACLMatchedName}
access_log stdio:/var/log/squid/access.json jsonlog blocklist_stevenblack

access_log /var/log/squid/access.log
cache_log /var/log/squid/cache.log
In this configuration, the Squid Proxy listens on port 3128, and a blocklist is applied to prevent access to harmful domains. Additionally, detailed logs are generated in JSON format, which includes information such as the timestamp, client IP, request method, URL, and whether a domain was blocked.
This setup ensures a safe and controlled internet experience for children by blocking inappropriate content and providing an easy way to monitor all browsing activity.
Suricata - Intrusion Detection and Prevention System (IDS/IPS)
Suricata is an open-source intrusion detection and prevention system (IDS/IPS) designed to monitor network traffic and detect suspicious activity. It is capable of real-time traffic analysis and packet capture, making it an essential tool for network security.
In this setup, Suricata is configured to run in a Docker container with access to the host's network interface, enabling it to capture and analyze all traffic passing through the network.
Docker Configuration
suricata:
  image: jasonish/suricata:latest
  container_name: suricata
  hostname: suricata-home-network-guardian
   network_mode: host
	volumes:
	- './etc-suricata:/etc/suricata'
	- './var-log-suricata:/var/log/suricata'
	cap_add:
	- NET_ADMIN
	- SYS_NICE
	command: ["-c", "/etc/suricata/suricata.yaml", "-i", "eth0"]
	restart: unless-stopped
Configuration Details
Suricata's configuration is highly customizable and includes detailed settings for network traffic analysis, logging, and alerting. However, due to the complexity of the configuration, it is too extensive to explain fully here. For a deeper dive into Suricata's configuration files and setup, you can access them on the GitHub repository at the following link:
View Suricata Configuration on GitHubThis repository includes all the necessary configuration files to fine-tune Suricata for specific use cases and network environments, ensuring optimal protection for your home network.
Prometheus and Grafana - Monitoring and Visualization
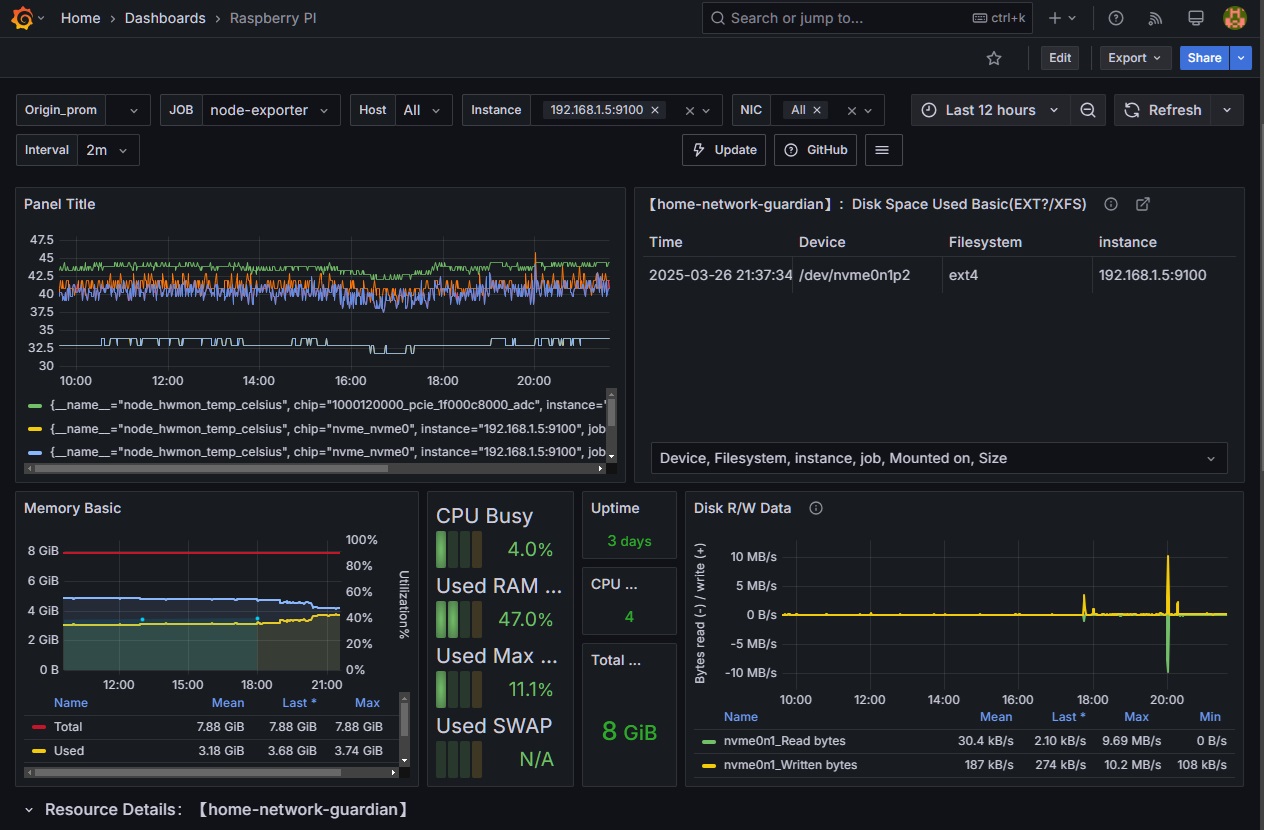
Prometheus is an open-source monitoring and alerting toolkit widely used for recording real-time metrics and monitoring system performance. It collects metrics from configured targets at specified intervals, processes them, and stores them in a time-series database. These metrics can then be queried and visualized using Grafana.
Grafana is a powerful open-source data visualization and analytics platform. It allows you to create beautiful dashboards and graphs using data collected by Prometheus (and other data sources). With Grafana, you can visualize metrics, set up alerts, and monitor your system's health and performance over time.
Prometheus Docker Configuration
prometheus:
  image: prom/prometheus:latest
  container_name: prometheus
  hostname: prometheus
  network_mode: host
  volumes:
	- './etc-prometheus/prometheus.yml:/etc/prometheus/prometheus.yml'
	- 'prometheus_data:/prometheus'
  restart: unless-stopped
Grafana Docker Configuration
grafana:
  image: grafana/grafana:latest
  container_name: grafana
  hostname: grafana
  network_mode: host
  volumes:
	- './etc-grafana/provisioning:/etc/grafana/provisioning'
	- './etc-grafana/dashboards:/etc/grafana/dashboards'
	- 'grafana_data:/var/lib/grafana'
  restart: unless-stopped
Prometheus Configuration
Prometheus is configured to scrape metrics from nodes at regular intervals. Below is an example of the Prometheus configuration file that scrapes data from a node exporter running on a target machine (IP: 192.168.1.5):
global:
  scrape_interval: 15s

scrape_configs:
  - job_name: 'node-exporter'
	static_configs:
	  - targets: ['192.168.1.5:9100']
This configuration ensures that Prometheus collects system metrics (such as CPU, memory, disk, and network usage) from the node exporter every 15 seconds. The collected data is then available for visualization and analysis in Grafana.
Both Prometheus and Grafana play a crucial role in monitoring the performance and health of your system. Prometheus collects and stores metrics, while Grafana presents these metrics in an easy-to-read, visual format that helps identify issues and optimize configurations.
Portainer - Docker Management
Portainer is a lightweight and easy-to-use management interface for Docker. It provides a web-based UI that allows you to manage Docker containers, images, networks, and volumes. With Portainer, you can easily monitor and control your Docker environment, whether it's on a local machine or remote servers.
Portainer simplifies container management by providing features like:
- Easy-to-use web interface for managing Docker environments
- Container, image, volume, and network management
- Multi-cluster support (Docker Swarm, Kubernetes)
- User management and access control
Portainer Docker Configuration
portainer:
  image: portainer/portainer-ce:latest
  container_name: portainer
  hostname: portainer
  networks:
	internal_network:
	  ipv4_address: 172.20.0.8
  ports:
	- "9010:9000/tcp"
  volumes:
	- /var/run/docker.sock:/var/run/docker.sock
	- './portainer_data:/data'
  restart: unless-stopped
The configuration above will start a Portainer container with the following key features:
- **Image**: Uses the latest Portainer Community Edition image from Docker Hub.
- **Ports**: Maps Portainer’s web interface to port 9010 on the host machine (accessible via
http://).:9010 - **Volumes**: Mounts the Docker socket (`/var/run/docker.sock`) to allow Portainer to interact with Docker and access container metadata. It also stores Portainer's data (e.g., user settings and configurations) in a persistent volume (`./portainer_data`).
- **Networks**: Assigns a static IP address within the internal network (`172.20.0.8`).
- **Restart Policy**: The container will automatically restart unless stopped manually.
Portainer is an essential tool for anyone working with Docker as it greatly simplifies the management of containers and other Docker resources. With its intuitive interface, you can perform actions like starting, stopping, and inspecting containers with just a few clicks. Additionally, it provides access to detailed logs, metrics, and settings, making Docker management more accessible and efficient.
MongoDB, Elasticsearch & Graylog - Log Management Solution
This section describes a powerful log management solution built using MongoDB, Elasticsearch, and Graylog. These three services work together to collect, store, and analyze log data, providing deep insights into your system's performance and security.
Key Features
- Centralized log collection and analysis
- Real-time log search and filtering
- Customizable log dashboards and visualizations
- Scalable architecture to handle large amounts of log data
Docker Configuration
mongo:
	image: mongo
	container_name: mongo
	hostname: mongo
	network_mode: host
	environment:
	  MONGO_INITDB_ROOT_USERNAME: "${MONGODB_USERNAME}"
	  MONGO_INITDB_ROOT_PASSWORD: "${MONGODB_PASSWORD}"
	volumes:
	  - './etc-mongo:/data/db'
	restart: unless-stopped

elasticsearch:
	image: docker.elastic.co/elasticsearch/elasticsearch:7.17.0
	container_name: elasticsearch
	hostname: elasticsearch
	network_mode: host
	environment:
	  - "discovery.type=single-node"
	  - "ES_JAVA_OPTS=-Xms512m -Xmx512m"
	volumes:
	  - './etc-elasticsearch:/usr/share/elasticsearch/data'
	ports:
	  - "9200:9200"  # Mapping port 9200 to host
	restart: unless-stopped

graylog:
	image: graylog/graylog:6.1
	container_name: graylog
	hostname: graylog
	network_mode: host
	environment:
	 - GRAYLOG_HTTP_EXTERNAL_URI=http://127.0.0.1:9000/
	 - GRAYLOG_PASSWORD_SECRET=${GRAYLOG_PASSWORD_SECRET}
	 - GRAYLOG_ROOT_PASSWORD_SHA2=${GRAYLOG_ROOT_PASSWORD_SHA2}
	 - GRAYLOG_MONGODB_URI=mongodb://graylog:${MONGODB_PASSWORD}@127.0.0.1:27017/graylog
	 - GRAYLOG_ELASTICSEARCH_HOSTS=http://127.0.0.1:9200
	volumes:
	  - './etc-graylog:/etc/graylog'
	  - './var-log-graylog:/var/log/graylog'
	depends_on:
	  - mongo
	  - elasticsearch
	restart: unless-stopped
Why These Services Work Together
MongoDB, Elasticsearch, and Graylog work together as a powerful log management stack. MongoDB is used by Graylog for storing configurations and metadata, while Elasticsearch serves as the backend for full-text search and fast querying of log data. Graylog acts as the centralized interface for log collection, search, and analysis.
These three services must work together because:
- MongoDB is used by Graylog to store its configuration and metadata, ensuring that Graylog's setup is persistent across restarts.
- Elasticsearch is where Graylog stores and indexes log messages, enabling fast search and analytics.
- Graylog provides the web interface and API for accessing logs, as well as powerful search and dashboard features that rely on both MongoDB and Elasticsearch.
Log Collection with Filebeat
For collecting logs, we use Filebeat, which is installed directly on the host machine. Filebeat forwards log data to Graylog through Logstash, allowing real-time log analysis. Below is the Filebeat configuration:
filebeat.inputs:
  - type: filestream
	id: suricata-logs
	enabled: true
	paths:
	  - /home/hunter/var-log-suricata/eve.json
	json.keys_under_root: true
	json.add_error_key: true
	fields:
	  log_type: suricata
	fields_under_root: true

output.logstash:
  hosts: ["127.0.0.1:5044"]
This Filebeat configuration ensures that Suricata logs are captured and forwarded to Graylog via Logstash. The use of Filebeat in this stack ensures efficient log collection and reduces the load on the main services, allowing for optimal performance.
Conclusion
This comprehensive Docker-based network security solution provides multiple layers of protection, monitoring, and control. By integrating services like Unbound, Pi-hole, Squid, Graylog, Suricata, and Portainer, you create a robust home network environment that prioritizes privacy, security, and performance.
Thanks to the implementation of advanced services, I have built a comprehensive solution to secure my home network. First, the use of filtering and blocking systems protects against ads, tracking, and potential threats from the internet. The integration of monitoring and log collection tools allows me to analyze network traffic in real time, identify potential attacks, and respond immediately.
Moreover, data storage and indexing systems enable faster information retrieval, allowing me to analyze logs and quickly detect any anomalies. With automatic alerts, I can promptly react to threats and take the necessary steps to protect my network.
By utilizing data visualization tools, I have gained full control over my network, allowing for effective monitoring of system status and ensuring that all services are operating correctly. This integrated solution empowers me to efficiently manage the security of my home network, improving privacy, performance, and resilience against attacks.
I’ve spent over 1.5 months perfecting this solution, and even though it's already a robust and secure system, my mind is still full of ideas for further improvements and enhancements. There's always something new to explore, and the journey to make my network even safer is far from over.